PupilMetrics Neuro · v1.2.0 · Drug Effect Monitor · v1.0.0
A clinical monitoring instrument — built to measure healing, not to make accusations.
Quantitative, repeatable pupillary light reflex measurement for neurologists, concussion clinics, sports medicine and clinical research — with the Drug Effect Monitor built on the same recording engine.
Windows, Android and macOS. Everything runs on the device; nothing is transmitted during clinical operation.
- Pupil diameter per frame, five-point median smoothed before any metric is taken
- Dark-adapted baseline the reference every amplitude is measured against
- Neuro
- v1.2.0 · 20 locales
- Drug Effect Monitor
- v1.0.0 · 15 locales
- Platforms
- Windows 10 64-bit · Android 8.0+ · macOS
- Regulatory status
- No 510(k), no CE mark. Research use.
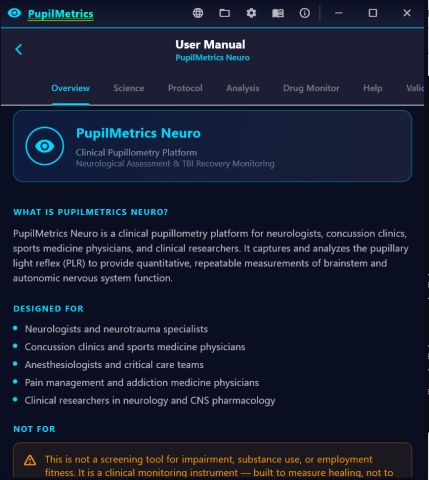
Who it is for, and who it is not for
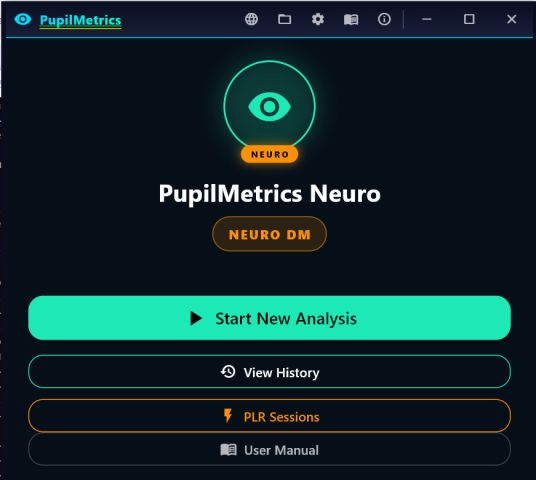
This one matters more than the feature list, so it comes first — on this page and on the app's own opening screen.
Designed for
- Neurologists and neurotrauma specialists
- Concussion clinics and sports medicine physicians
- Anaesthesiologists and critical care teams
- Pain management and addiction medicine physicians
- Clinical researchers in neurology and CNS pharmacology
Not for
This is not a screening tool for impairment, substance use or employment fitness. It is not validated for law enforcement drug detection, athletic doping control, or any non-clinical impairment assessment.
It is a clinical monitoring instrument — built to measure healing, not to make accusations. That sentence is in the software, on every results screen, in a form that cannot be dismissed.
Required hardware
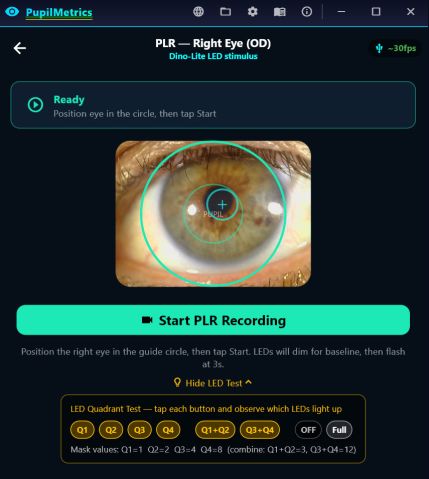
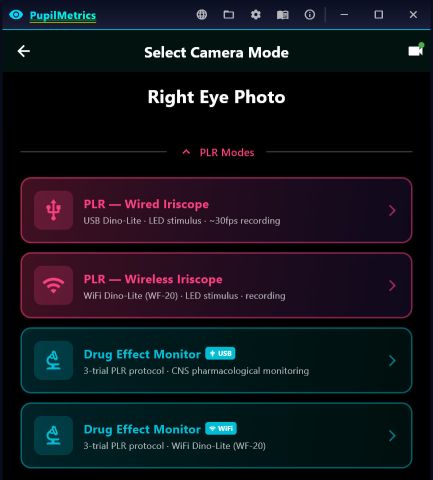
Neuro is built around the Dino-Lite digital iriscope — a USB clinical eye-imaging device with its own LED ring, which serves as both the illumination and the stimulus. Connect it before launching.
The LED quadrant test exposes the ring directly: tap each quadrant and confirm which lamps light. A stimulus you have not verified is a measurement you cannot trust, and a dead quadrant is otherwise invisible in the resulting trace.
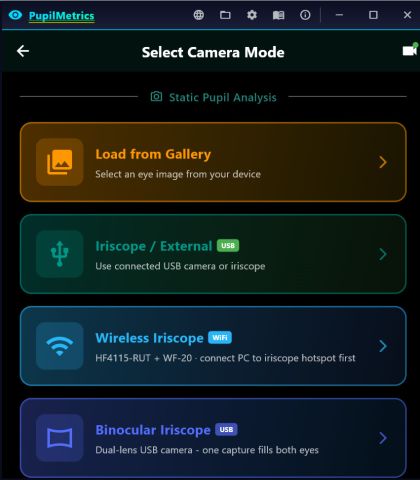
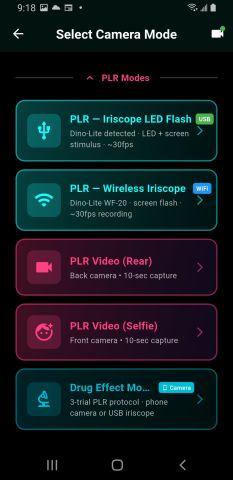
A wireless Dino-Lite over the WF-20 adapter, and on Android a rear or selfie camera with screen-flash stimulus, are supported alternatives — each reports the frame rate it actually achieves.
Seven numbers, and what each one is reading
Each is flagged against an age-adjusted reference band, and each flag carries an evidence tag saying whether that band was published, interpolated or estimated. See reference provenance.
| Metric | Normal range | What it reflects |
|---|---|---|
| Baseline diameter | 3–7 mm | Resting sympathetic and parasympathetic tone |
| PLR latency | 200–300 ms | Signal propagation through the pretectal nucleus |
| Constriction amplitude | 20–40% | Integrity of the parasympathetic efferent limb (CN III) |
| Constriction velocity | 3–8 mm/s | Brainstem processing speed; sensitive to diffuse axonal injury |
| Redilatation velocity | 2–5 mm/s | Sympathetic recovery; disrupted in autonomic dysfunction |
| Anisocoria | < 1 mm | Bilateral symmetry of neurological function |
| Habituation index | 0–15% | Cortical modulation of the reflex |
Direct brainstem injury
The pretectal and Edinger–Westphal nuclei sit in the midbrain, exposed to the rotational acceleration that characterises concussion. Mild diffuse axonal injury slows latency measurably before clinical signs appear.
Rising intracranial pressure
Herniation of the uncus compresses CN III. The earliest sign is a sluggish, asymmetric reflex — detectable by pupillometry before the pupil looks abnormal to the naked eye.
Lost cortical modulation
The frontal lobe damps the reflex across repeated stimuli. Losing that input produces either excessive habituation above 25% or paradoxical sensitisation — both signs of disrupted cortico-midbrain feedback.
The standard recording sequence
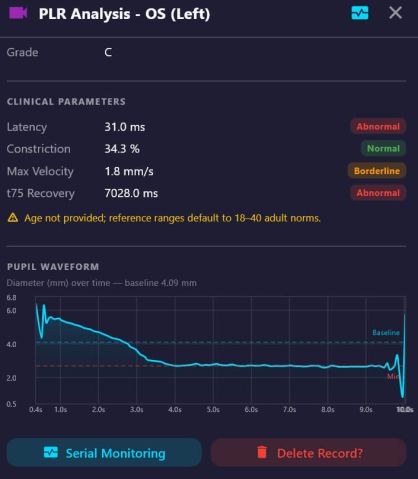
Fixed, so that two recordings a fortnight apart are comparable. The trace in the hero above is this sequence.
Why three seconds of darkness
Before each flash, all light is extinguished for a full three seconds. This is not padding — it is what makes the amplitude measurable:
- Rod photoreceptors begin scotopic adaptation, raising retinal sensitivity
- The dilator reaches maximum dilation under sympathetic drive
- Baseline diameter reaches its true dark-adapted maximum
- Amplitude is therefore measured from a consistent starting point, every time
Wall-clock timestamps, per frame
USB capture does not deliver its nominal frame rate — the bridge path runs nearer 11–15 fps than 30. Rather than assume a rate, the app embeds an actual wall-clock timestamp in every frame at capture time, and the analysis reads those directly.
The baseline and post-stimulus windows are therefore assigned correctly regardless of how the rate wobbles, and the report states the effective rate it achieved alongside a timing-resolution figure.
Three trials turn a measurement into a pattern
Three consecutive trials with standardised two-minute rests. In a healthy, unmedicated brain the amplitude falls slightly across repeated identical stimuli. CNS drugs disturb that modulation in class-specific directions — which no single trial can show.
- Trial 1 full amplitude — the reference the index is computed against
- Trial 2 after two minutes' rest
- Trial 3 the amplitude that closes the index
| HI range | Interpretation |
|---|---|
| Negative | Sensitisation — a paradoxical increase across trials |
| 0–15% | Normal cortical modulation |
| 15–30% | Moderate habituation — warrants monitoring |
| > 30% | Excessive habituation — disrupted cortico-midbrain feedback |
All three curves are drawn on a single timeline for direct comparison of waveform shape, onset timing, constriction depth and redilatation kinetics.
Recovery is a trajectory, not a reading
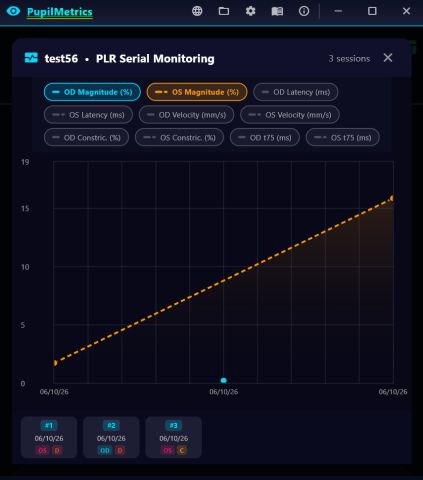
Recovery from brain injury unfolds over days, weeks and months. A single ambiguous finding becomes clinically meaningful only when the file behind it shows a direction.
What a series is expected to show
Pupillary diameter normalising — autonomic tone returning.
Amplitude improving — parasympathetic efferent recovery.
Anisocoria resolving — bilateral symmetry restored.
Habituation normalising — the cortical–midbrain circuit coming back.
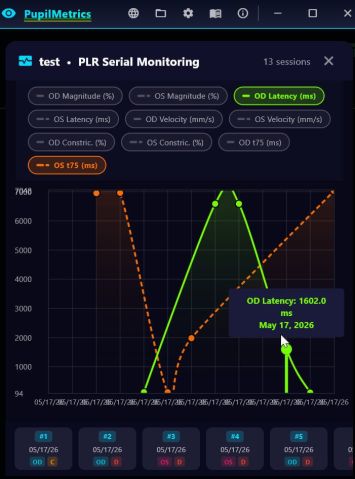
Eight series are available per eye, each toggled independently, with every session reachable from the strip beneath the chart.
| Grade | Difference | Clinical action |
|---|---|---|
| Physiological | < 5% | No action required |
| Mild | 5–10% | Document; monitor in serial scans |
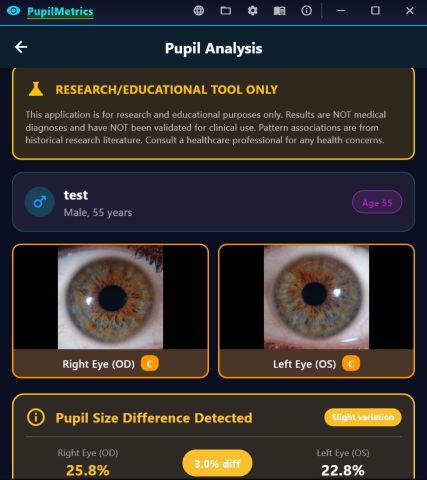
| Significant | > 10% | Clinical evaluation recommended |
The reflex as a pharmacodynamic endpoint
Built into Neuro, and available as a standalone Android application. It applies the same PLR recording as a non-invasive measure of CNS drug effect — for physicians who need objective evidence of what a dose is doing, not for anyone trying to find out what somebody took.
The questions it exists to answer
- Is this patient's opioid dose producing the expected degree of CNS effect?
- Is anaesthesia wearing off appropriately after surgery?
- Is the ICU sedation level appropriate, or is this patient over-medicated?
- Has this athlete's pain medication cleared enough for a valid neurological exam?
- Is this psychiatric medication producing measurable autonomic effects?
What it does not report
It does not identify drugs. A miotic, hypo-reactive pupil is equally consistent with morphine for post-operative pain, methadone or buprenorphine in treatment, over-the-counter diphenhydramine, pilocarpine drops for glaucoma — or a patient who slept three hours and is profoundly fatigued.
Every positive pattern is displayed together with the list of prescribed medications that produce indistinguishable findings. There is no display without the confounders.
A protocol tuned for pharmacology
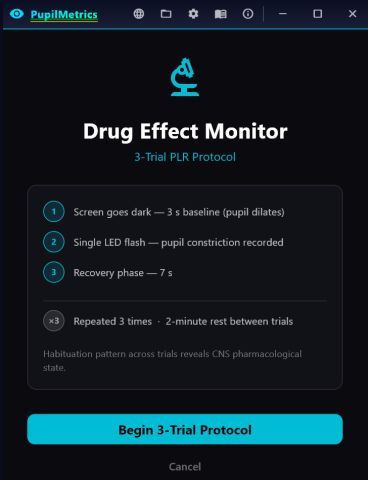
Same skeleton as the standard sequence, three parameters widened — because a drugged pupil is a slow pupil, and a window sized for a normal response truncates the thing you are trying to measure.
| Parameter | Value | Rationale |
|---|---|---|
| Dark baseline | 3 s | Full dark-adapted dilation; maximises dynamic range |
| Flash duration | 500 ms | Longer than the standard 200 ms — captures sluggish pharmacological responses |
| Recovery window | 7 s | Extended to capture redilatation kinetics and PIPR at 6 s |
| Inter-trial rest | 2 min | Minimum for full sympathetic recovery to dark-adapted baseline |
| Number of trials | 3 | Minimum for a meaningful habituation index |
| Pattern | Baseline | Constriction | Velocity |
|---|---|---|---|
| CNS depressant | < 22% (miosis) | < 20% | any |
| CNS stimulant | > 38% (mydriasis) | ≥ 18% | any |
| Cannabis / THC | 24 – 38% | 12 – 30% | < 30 %/s |
| Alcohol / sedative | 22 – 44% | < 20% | < 35 %/s |
| Normal | 22 – 38% | ≥ 20% | — |
| Indeterminate | none of the above | ||
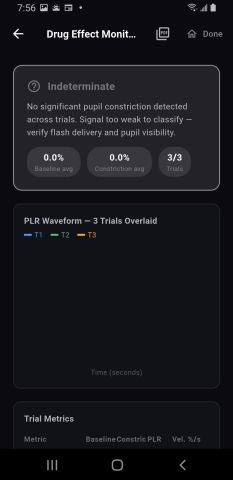
“Indeterminate” is a real and frequent result, not a failure mode. A rule-based classifier that always returns a class is a classifier that is guessing.
CNS depressants
Opioids, benzodiazepines, barbiturates, alcohol and cholinergic agents suppress brainstem autonomic circuits. Opioids produce bilateral, dose-dependent pinpoint miosis through paradoxical activation of the Edinger–Westphal nucleus; benzodiazepines mostly slow the dynamics — longer latency, lower velocity — without marked miosis at therapeutic doses.
CNS stimulants
Amphetamines, cocaine and anticholinergics produce mydriasis by sympathomimetic action on the dilator or by blocking muscarinic receptors on the sphincter. The result is a large resting pupil, often with paradoxically sluggish constriction as the activated dilator resists parasympathetic suppression.
Cannabis / THC
CB1 receptors are dense in cerebellum, basal ganglia and superior colliculus. THC reduces the speed of the constriction command without fully suppressing its amplitude — a velocity–amplitude dissociation, with peak velocity down 20–40% and amplitude little changed. Opioids suppress both; stimulants preserve both.
PIPR separates drug effect from structural damage
After a bright flash ends, intrinsically photosensitive retinal ganglion cells keep firing via melanopsin for 5–10 seconds, holding the pupil down. PIPR is quantified at 1 s and 6 s after flash offset, and the combination with the PLR is what carries the information:
| Scenario | PLR amplitude | PIPR | Interpretation |
|---|---|---|---|
| Pharmacological CNS depression | Suppressed | Preserved | Consistent with drug effect; ipRGC firing unaffected |
| Structural pretectal damage | Suppressed | Suppressed | Concern for severe TBI, midbrain compression or Parinaud syndrome |
| CNS stimulant pattern | Variable | Normal | ipRGC–hypothalamic pathways intact |
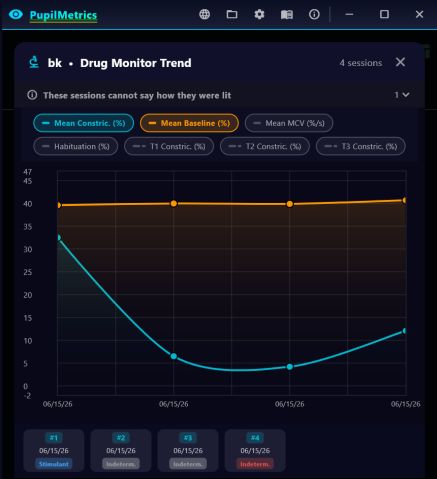
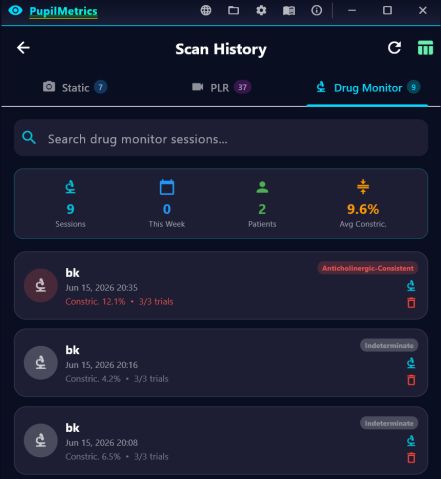
Note the banner in the screenshot above: “these sessions cannot say how they were lit.” Sessions recorded under unknown illumination are marked as such rather than plotted as if comparable.
The ethical framework, as implemented
- Mandatory medication flags. Every CNS pattern result carries the list of prescribed medications producing identical findings. No display without confounders.
- Explicit disclaimer. Every results screen carries a non-dismissible statement that the tool is not validated for drug screening, law enforcement or employment purposes.
- Clinical context framing. The system presents a pharmacodynamic pattern, not a drug identification. The interpretation belongs to the physician.
- No pattern logging. Pattern classifications are not stored in the scan database. The PLR waveform is the measurable output, and it is the only thing kept.
The standalone Android build
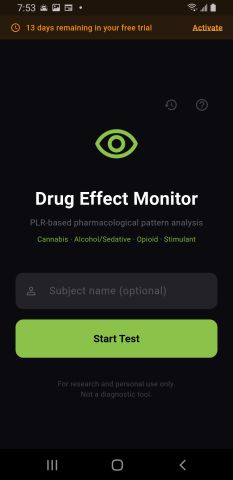
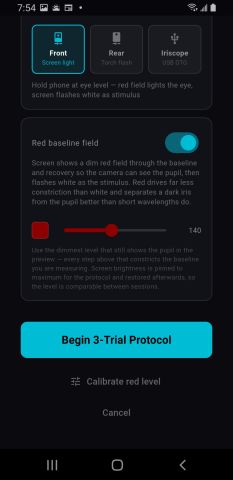
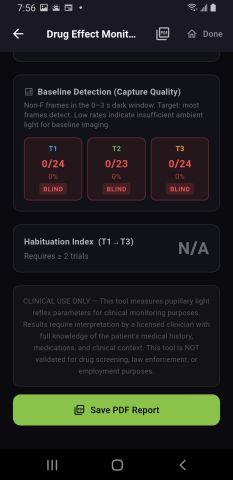
The Drug Effect Monitor also ships on its own — same protocol, same classifier, same disclaimers, in a single-purpose application for a phone.
Where it runs
Windows
Windows 10 64-bit · USB 2.0 for the iriscope
- The primary clinical target; deepest Dino-Lite integration
- Direct-USB capture path with measured frame rate and per-frame µs timestamps
- LED quadrant test for verifying the stimulus
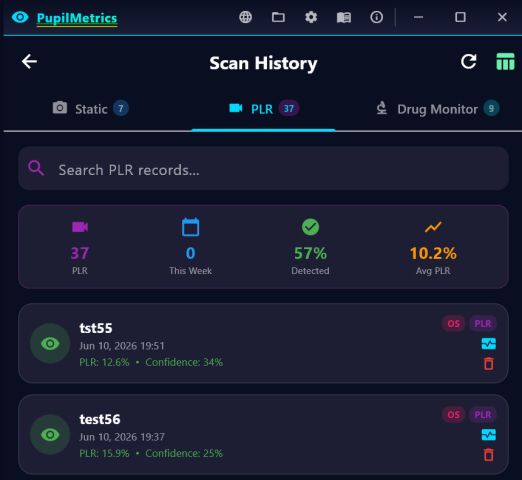
- PLR Sessions screen for serial comparison
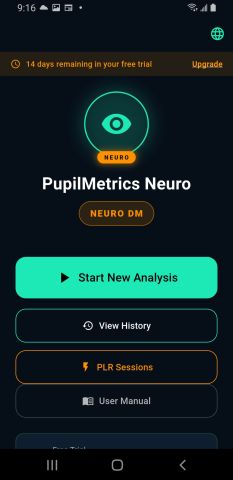
Android
Android 8.0+ · USB OTG optional
- Iriscope LED flash over OTG, or screen-flash stimulus with the front camera
- Rear and selfie PLR video capture, 10-second recordings
- Drug Effect Monitor built in, plus the standalone build
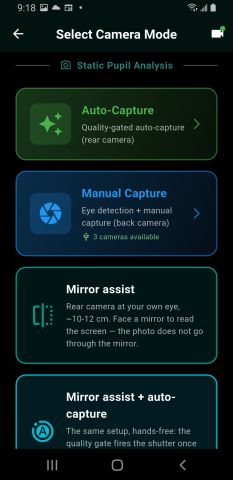
- Mirror-assist and quality-gated auto-capture for static scans
macOS
Signed DMG, built on CI
- Install directly from cnri.edu
- Same desktop feature set as Windows
- Iriscope support depends on UVC compliance of the device
Desktop
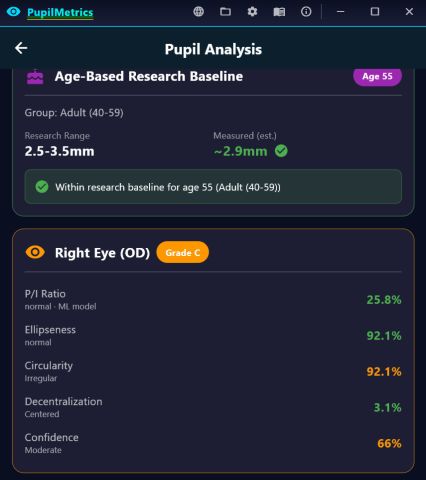
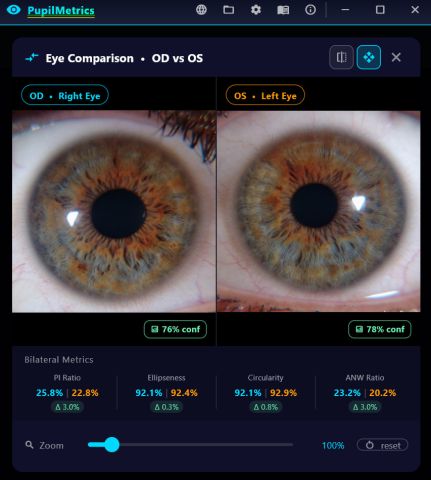
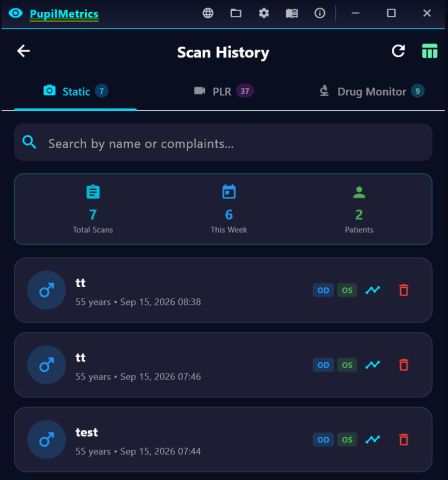
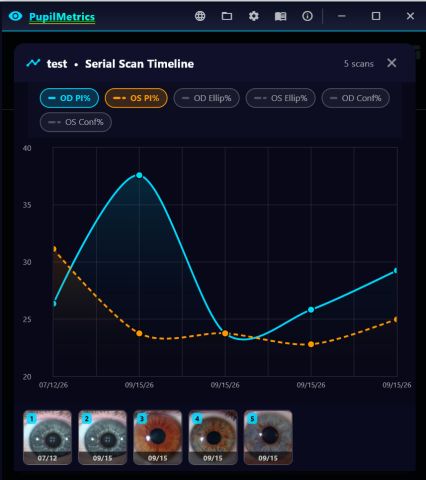
Android
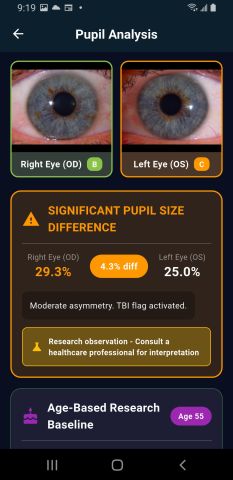
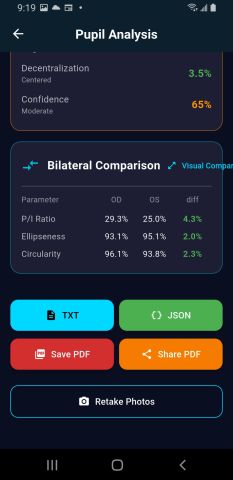
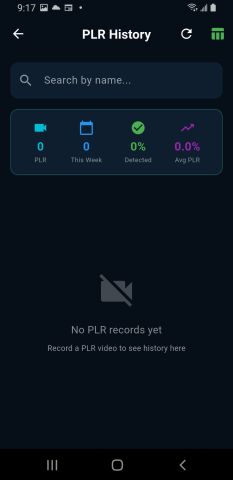
What we have measured, and what we have not
This section exists for institutional procurement and ethics review. PupilMetrics Neuro is a research instrument and has not been validated against a reference pupillometer. What follows describes what the software does — it is not a claim of clinical accuracy.
Size calibration
Every absolute millimetre figure comes from one scale: mm per pixel = assumed horizontal iris diameter ÷ median iris diameter in pixels. The assumed diameter defaults to 11.5 mm when no per-subject value is entered, and real adult iris diameter runs about 10.2–13.0 mm.
So: latency, constriction percentage and T75 are time- or ratio-based and are unaffected. Baseline and minimum diameter, peak velocity in mm/s, and PIPR amplitude in mm all scale with that assumption. Enter a measured iris diameter when absolute millimetre metrics matter.
Stimulus dependence
Constriction amplitude, velocity and PIPR depend strongly on stimulus intensity, wavelength, duration and light/dark adaptation. The reference ranges were published for specific stimulus conditions; if your device's stimulus differs, those comparisons are indicative only.
Record your stimulus specification — wavelength, intensity in physical units, duration, adaptation — with any dataset intended for publication.
Reference provenance
Every reference range carries an evidence tag, printed next to its flag on the exported report.
Published — taken directly from a peer-reviewed source for that age band: latency, constriction and T75 for 18–40 and 61+ (Bitsios et al., 1996).
Interpolated — not directly measured, linearly interpolated between published bands: the 41–60 band.
Estimated — provisional, derived or transferred from a non-stimulus-specific source: all velocity and all PIPR ranges. Treat borderline or abnormal flags on these as hypotheses, not findings.
Sampling and latency resolution
Recording targets about 30 fps, and the report states the effective rate achieved together with a timing resolution — the 95th-percentile inter-frame interval. At 30 fps a frame is about 33 ms, and real inter-frame gaps of 27–131 ms have been observed on dropped frames.
Single-event metrics, latency above all, cannot be resolved finer than about one frame. Latency differences below one or two frames are not meaningful at 30 fps. Use 60–120 fps for latency-sensitive work.
Report traceability
Every exported report and JSON record carries the app version, the analysis parameters — assumed iris diameter, age group, effective frame rate, timing method, stimulus duration — and the provenance tags. Retain the JSON alongside the PDF. It is the authoritative machine-readable record.
Required for clinical validation
None of the following is established for this instrument, and all would be required before any clinical — as opposed to research — use:
- A method-comparison study against a reference pupillometer, with Bland–Altman limits of agreement
- Test–retest repeatability, as an intraclass correlation
- Sensitivity and specificity of the abnormality flags against a criterion standard
- A documented stimulus specification in physical units
Until those exist, every output is for research and documentation only. We are actively interested in collaborators in a position to run them.
The PMi index is experimental
PMi condenses the PLR panel into a single 0–5 score, shaped to read like a familiar neuro-index scale — 5 is fully normal, below 3 is abnormal. Unlike a proprietary black box it is auditable by design: the formula, weights and normative values are published in the app source, and every scan returns the score broken down term by term.
PMi = 5 · exp(−0.35 · z̄)
Each parameter gets a directional z-score against age-adjusted norms — penalising only deviation in the pathological direction — combined as a weighted mean. Constriction amplitude and peak velocity carry the most weight, then latency and T75, with PIPR amplitude lowest. Terms that are missing or below quality are dropped and the remaining weights re-normalised; at least three usable terms are required, and below that the card reads unavailable rather than showing a misleading number.
PMi is experimental and unvalidated. It is not equivalent to, nor a substitute for, any regulatory-cleared pupillary index, and carries no outcome validation.
Reflections are flagged, not silently tolerated
When a corneal reflection lies closer to the pupil border than a set fraction of the pupil radius, a warning appears on the result card, in the PDF and on the stored scan. The analysis still runs and no measurement is withheld — but a border finding on that eye may have been produced by the light rather than by the iris.
The warning identifies images at risk, not every affected image: a reflection just outside the limit can still create a zone finding.
The short version
Regulatory status
PupilMetrics Neuro has not been submitted for FDA 510(k) clearance or CE marking. All outputs must be interpreted by qualified clinicians in the context of the full clinical picture.
Not for screening or law enforcement
Not validated for employment fitness screening, law enforcement drug detection, athletic doping control, or any non-clinical impairment assessment. Pattern classifications indicate physiological states consistent with broad drug classes — they do not identify substances and are not diagnostic.
Clinical judgment required
No output should be acted on without physician interpretation in full clinical context. PLR metrics are one input among many.
Data privacy
All patient data is stored locally on the device. No information is transmitted to external servers during clinical operation.
We would rather be measured than believed
If you run a concussion clinic, a neuro ICU, a sports medicine programme or a pupillometry lab — particularly if you have a reference instrument we could be compared against — we want to hear from you.